Spotify API Fun Vol 1
Similarity in Music Preference Networks across Platforms
I decided to start my blog off with a short series I’m calling spotify api fun. In it, I’ll be sharing some things I’ve learned while exploring data from Spotify’s API. In this post, I’ll be combining data from Spotify’s and Twitter’s APIs to investigate the extent to which music preferences are expressed similarly across the two platforms.
I’ll be looking at The Grateful Dead’s Recommendation Network and the extent to which the artists artists in that network have followers in common on Twitter. I decided to focus on The Grateful Dead for two reasons. First, I’m a longtime fan. Second, they’re a sort of interesting case because they overlap with a lot of different genres, from Outlaw Country to Electronica, which should hopefully result in a pretty interesting network of artists.
According to Spotify, their recommendation algorithm is based on:
- Shared listeners on spotify, which ‘carry more weight’ in the algorithm.
- Similarity in how artists are descrbed on Spotify, and elsehwere on the internet (e.g., Blogs).
So, we can think of it as mostly a co-listener network, or a network describing the extent of artists’ shared listeners.
One quick note: I don’t show any of the code below, but a knitted, documented html of the code used in this blog is available here.
Downloading The Grateful Dead’s Recommendation Network
My first step was to download the data through Spotify’s API, which I did using the wonderful spotipy package for python. I used the tools in that package to search the Grateful Dead’s Recommendation Network. My basic idea was to:
- Get the 20 ‘related artists’ that appear on the Grateful Dead’s Profile
- Get each of those 20 artists’ related artists.
- Repeat to some pre-specified maximum depth.
The main decision I had to make was how high to set the maximum depth, which I ended up setting to 10. This means that the network was limited to artists that are at most 10 steps from the Grateful Dead (1 step = the Dead’s 20 recommended artists; 2 steps = the 400 or fewer unique artists in those 20 artists recommendation lists; etc.)
Visualizing The Grateful Dead’s Recommendation Network
As a first step, I wanted to visualize the network, highlighting artists distance from the Grateful Dead.
Distance from the Dead
I wanted to examine artists’ distance from the dead (the ego of this network) for two reasons:
I wanted to see how far we were able to get from the dead. Recall that the maximum would be 10 steps, but this would require virtually no overlap in related artists.
I wanted to do a sanity check: does distance seem to (roughly) track similarity?
The graph below shows the Grateful Dead’s Recommendation Network where nodes are colored by their distance from the Grateful Dead. You can select particular nodes by their name (ordered by distance) or highlight the collection of nodes a certain distance from the Grateful dead with the drop down options on the graph. The graph is also interactive, so feel free to hover over and drag around the nodes.
A couple of things immediately jumped out to me when I saw this graph:
The maximum distance from the dead is 4 steps. This suggests that related artists have a fair amount of overlap.
At the first step (in yellow) you can already start to anticipate how things might branch, as we have some of their contemporaries (e.g., New Riders of the Purple Sage), some of the jam band artists they inspired (e.g., Phish), traditional Bluegrass (Old & in the Way), as well as some of the Bluegrass/Newgrass that they inspired (e.g., Yonder Mountain String Band).
At two steps (in red), things really start to diversify. At one branch we have modern jam bands, some of which sound really different from the dead, bands like STS9, The Disco Biscuits, etc. On another branch you get deeper into the classic bluegrass and newgrass network (older artists like Doc & Merle Watson and newer ones like The Infamous Stringdusters). Finally, you have a more sparse branch of the network that has some of the offshoots of bands that were contemporary with the dead (e.g., Dickey Betts, Derek & the Dominoes, etc.).
At three steps (green), we have drastically different artists. As an example, at one end of the network is festival staple and Jazz-Funk band Medeski, Martin, & Wood and the other has Uncle Tupelo, perhaps best known as the predecessor to Wilco and Son Volt.
At four steps (purple), we actually contract quite a bit to a pretty small, dense, and not very diverse (genre-wise) network of bands. They all seem to be part of the electronica festival scene, which is distantly related to the Dead (via the jam band scene).
In all, this network made a fair amount of sense, so I decided to move on to the next step.
Downloading Artist-Follower Twitter Networks
Next, I took all of the artists in the network above, searched for that artists’ name on Twitter, did some screening to make sure the Twitter accounts I searched were indeed the artists I was looking for, and then retrieved full follower lists for all of these artists. Although these were pretty messy search results, I was able to use the Levenshtein distance metric to filter and check potential mismatches. The process worked well and was relatively painless, so I’d recommend checking out the RecordLinkage package and the levenshteinSim() function if you ever deal with messy search results. Even with these packages, this step was the most difficult and seems like a barrier to scaling up to running these analysis on a set of artists’ networks.
Working with Artist-Follower Networks
Before we get any further, we need to take a brief detour into the technical weeds of social network analysis. The full, combined Artist-Follower network can be thought of as a bipartite network, which basically means a network with two sets of nodes. In this case, that is artists and followers.
Brieger (1974), demonstrated bipartite networks can be projected to get associations between one of the node types based on the extent of co-occurence of the other node type. In other words, we can get how closely associated artists are based on how many followers they share, which we can call the artists’ co-follower network.
Visualizing Artists’ Co-Follower Network
First, we might want to visualize the network, which I’ve done below as a circle. This is the only layout that allows you to easily see just how interconnected the nodes are. Note that you can select nodes by artist name using the dropdown menu or interact with the graph by hovering over or clicking on nodes.
The big take-away from this particular graph is that artists related to each other through Spotify’s recommendation network are related through Twitter’s co-follower network.
So what does this mean?
It probably means that Artists with listeners in common on Spotify tend to have followers in common on Twitter, since Spotify says their recommendations are primarily based on shared listeners. Put differently, musical preferences as expressed by listening patterns on Spotify correspond to following patterns on Twitter.
This isn’t too surprising, but it does suggest that musical preferences are expressed similarly in these two very different platforms.
Comparing Artists Centrality in The Dead’s Recommendation & Co-Follower Networks
Lastly (for now), I wanted to follow up on this result. The above graph is a pretty coarse comparison, showing that members of the dead’s recommendation network on Spotify tend to also be connected via Twitter followers. Next, I wanted to see if these networks were structured similarly, focusing on node centrality. I did this by correlating artists’ Eigen Centrality the two networks.
First, I checked how each were distributed:
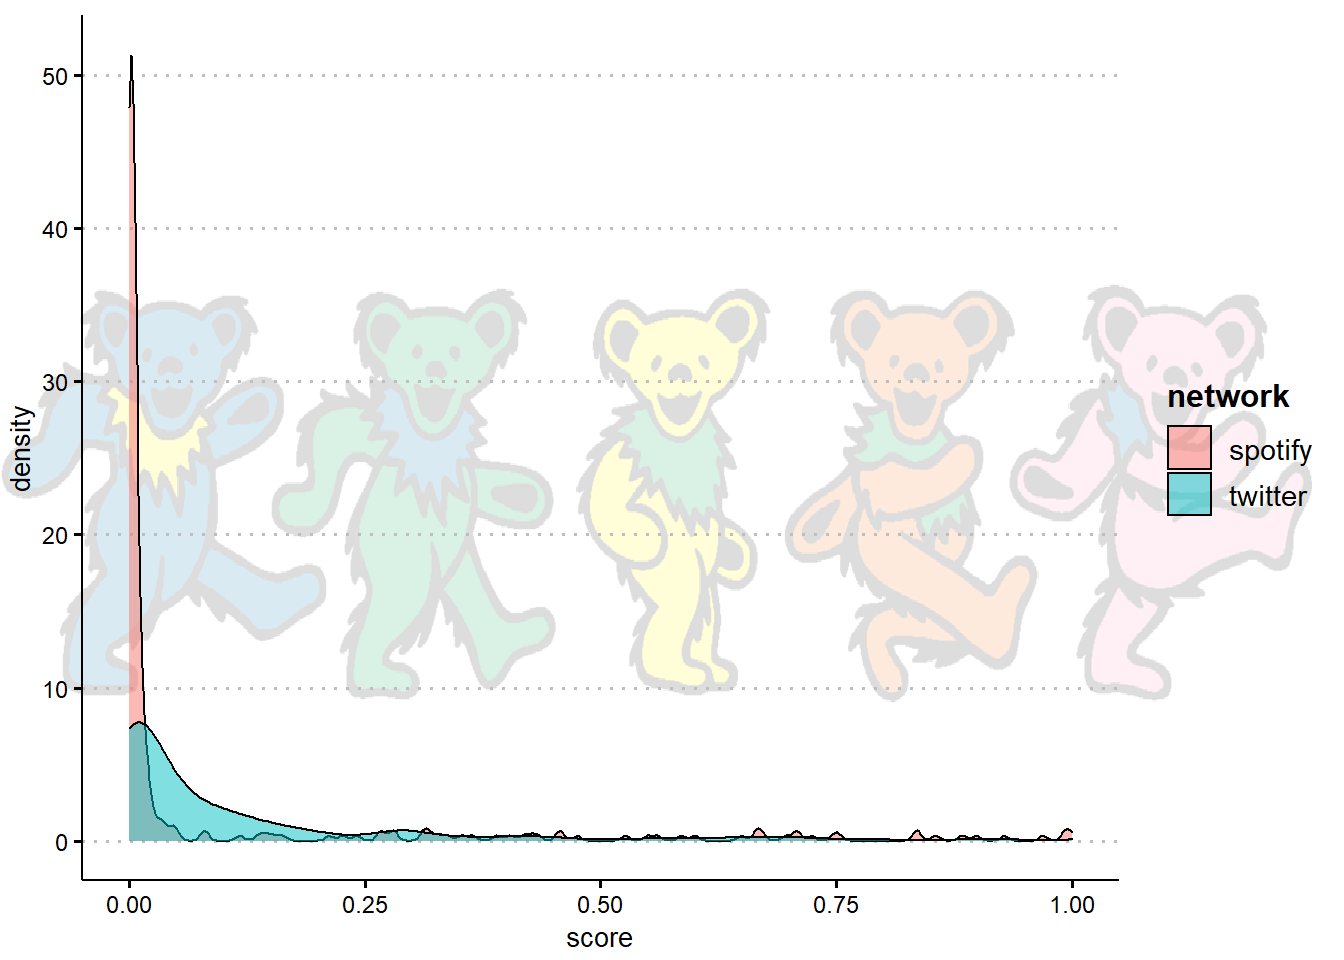
Noting the positive skew, I applied a log (base 10) transformation to each.
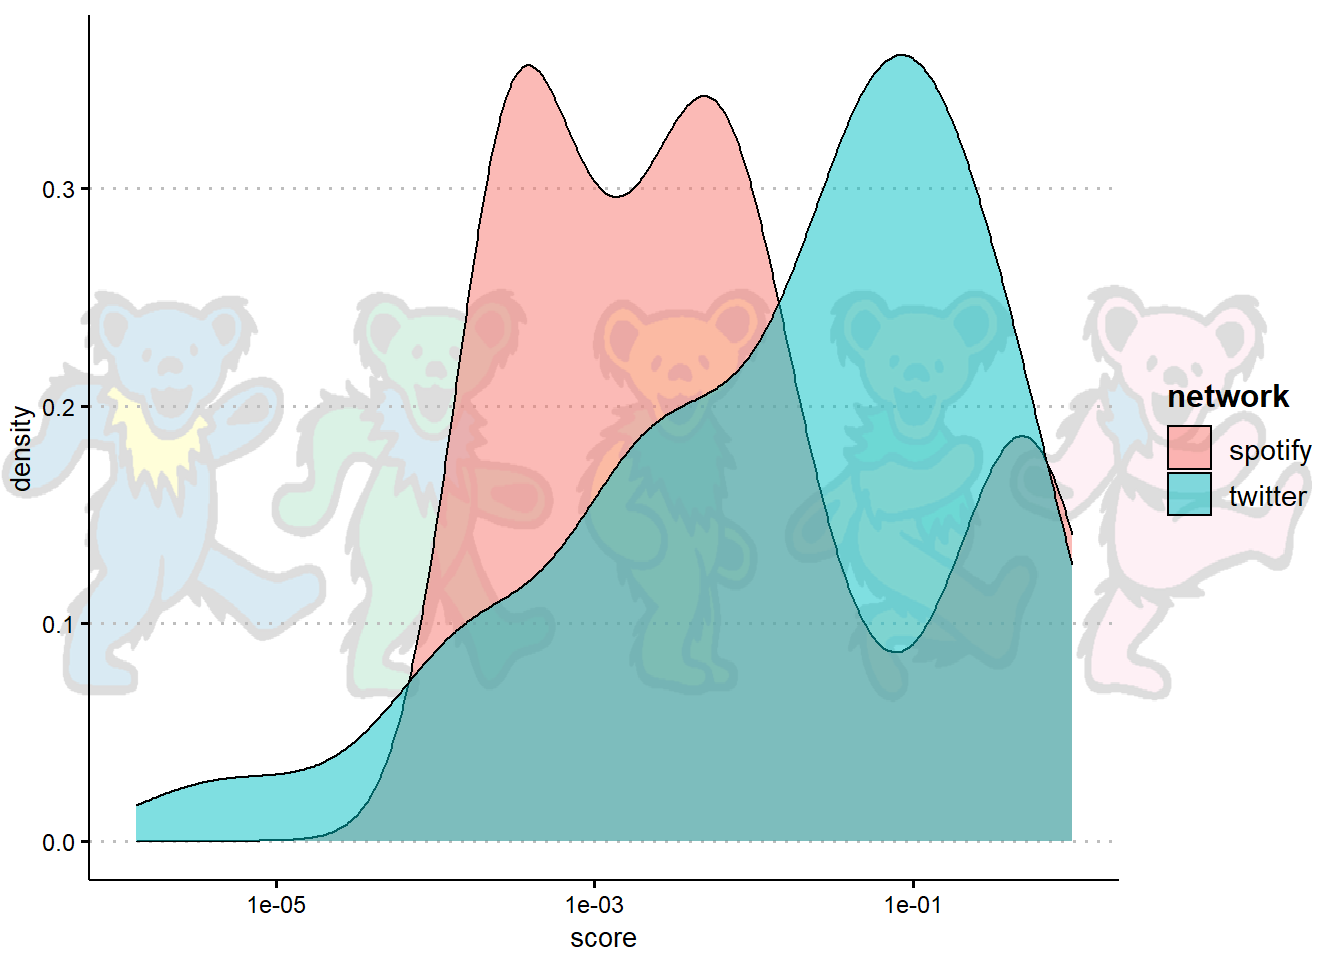
As you can see, the distributions aren’t perfectly normal but look much better.
Correlation between Artists Centrality in The Dead’s Recommendation & Co-Follower Networks
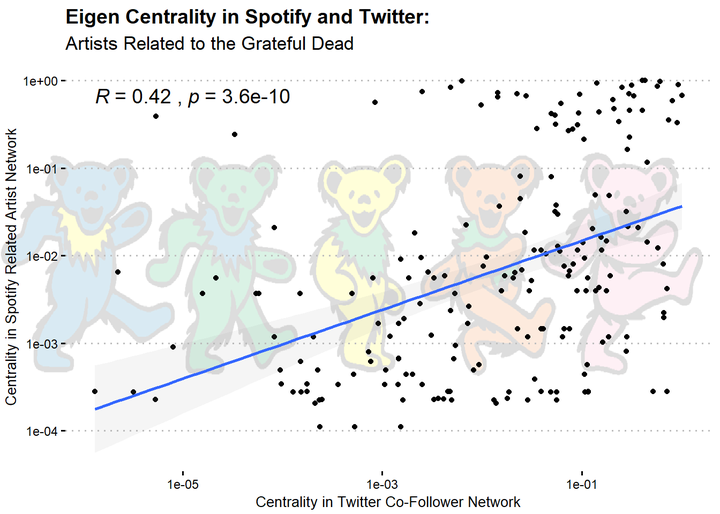
Finally, let’s take a look at their correlation by getting a scatter plot and a smoothed linear regression line.
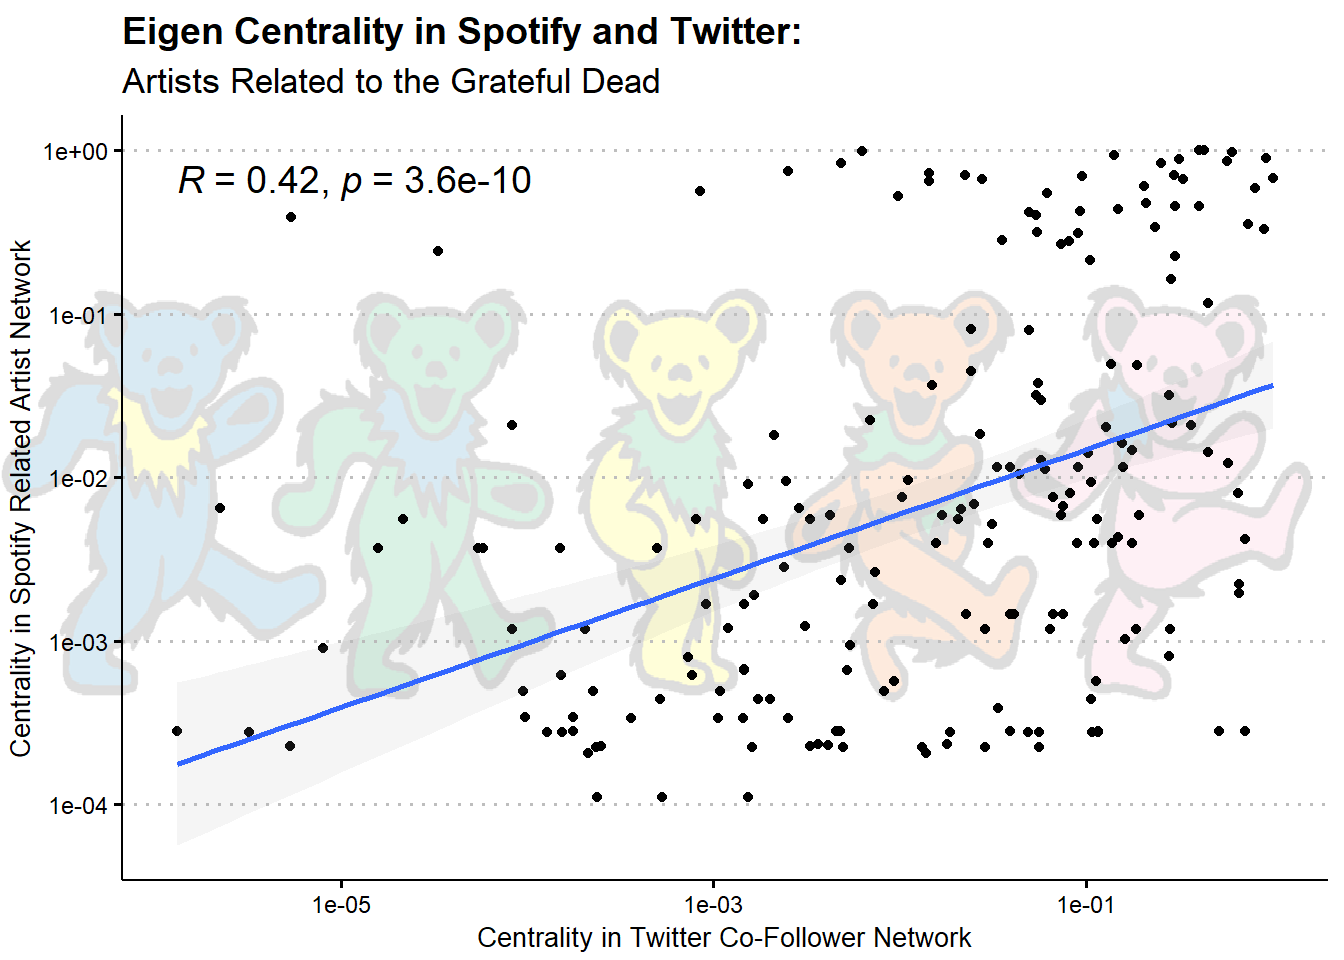
The above graph shows that an artists’ centrality in the Grateful Dead’s Spotify recommendation network is moderately correlated with their centrality in their Twitter co-follower network (r = .42), demonstrating further that music preferences are expressed similarly in Twitter and Spotify.
To get a better sense of what’s going on, let’s see who is highly central in both networks; I’ll label points that are above .6 centrality in both networks
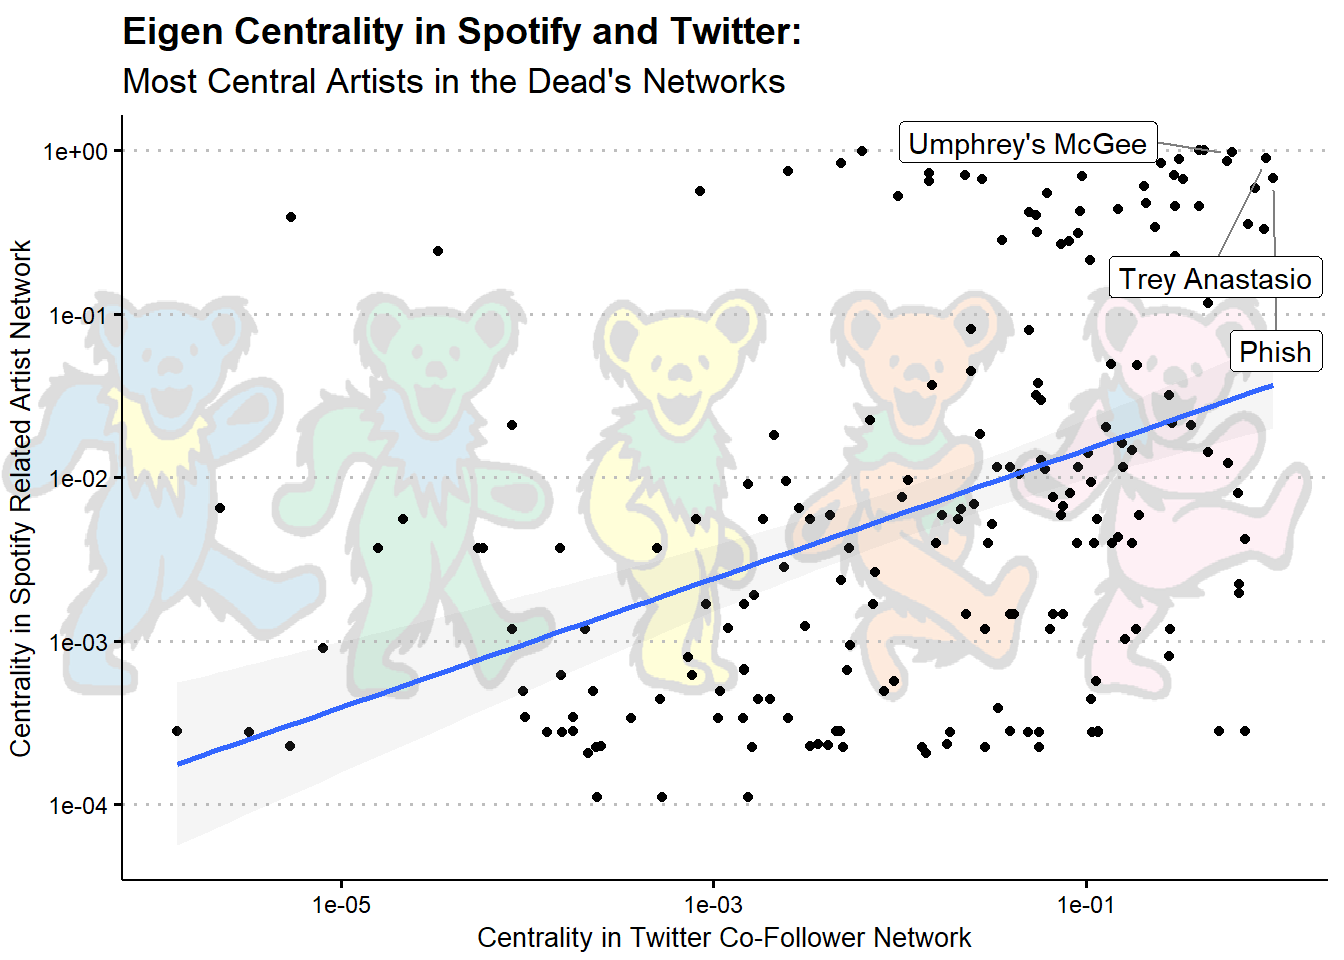
It looks like the most central nodes in both networks are Phish, Trey Anastasio (Phish’s guitarist & lead singer), & Umphrey’s McGee (another modern jam band). This makes a fair amount of sense - these popular newer jam bands probably have fans in common with both classic jam bands (e.g., the Dead) and more modern festival acts (e.g., EDM).
We can also take a look at the least central nodes, which are shown below
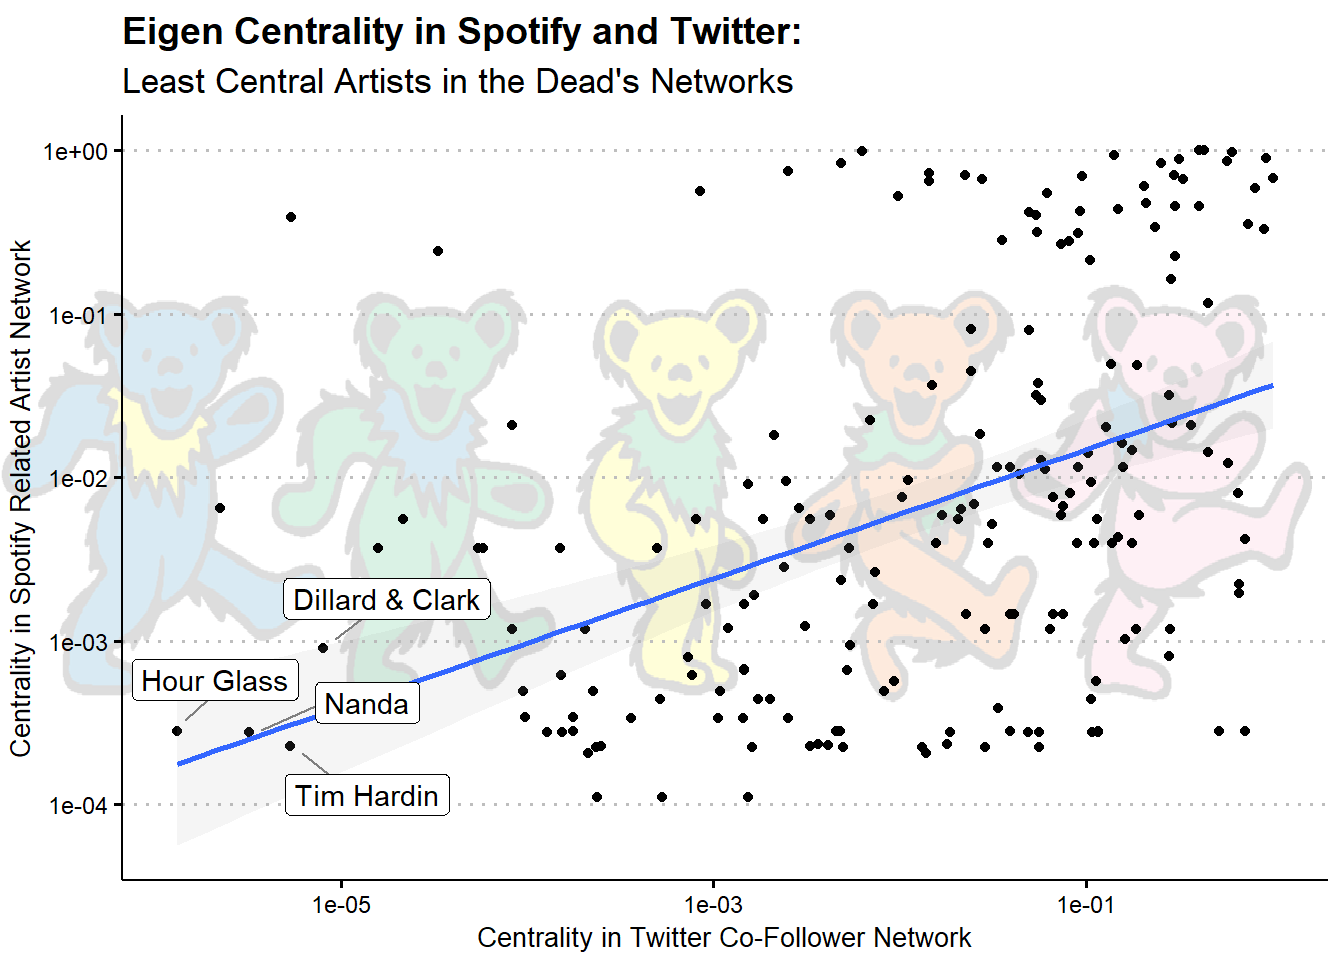
These are four artists that were new to me when I saw this data. Given that these were among a handful of artists in this data I’d never heard of, their low centrality seems to make intuitive sense as well.
The last thing we might want to look at are the points of divergence; which artists are more central in one network or the other?
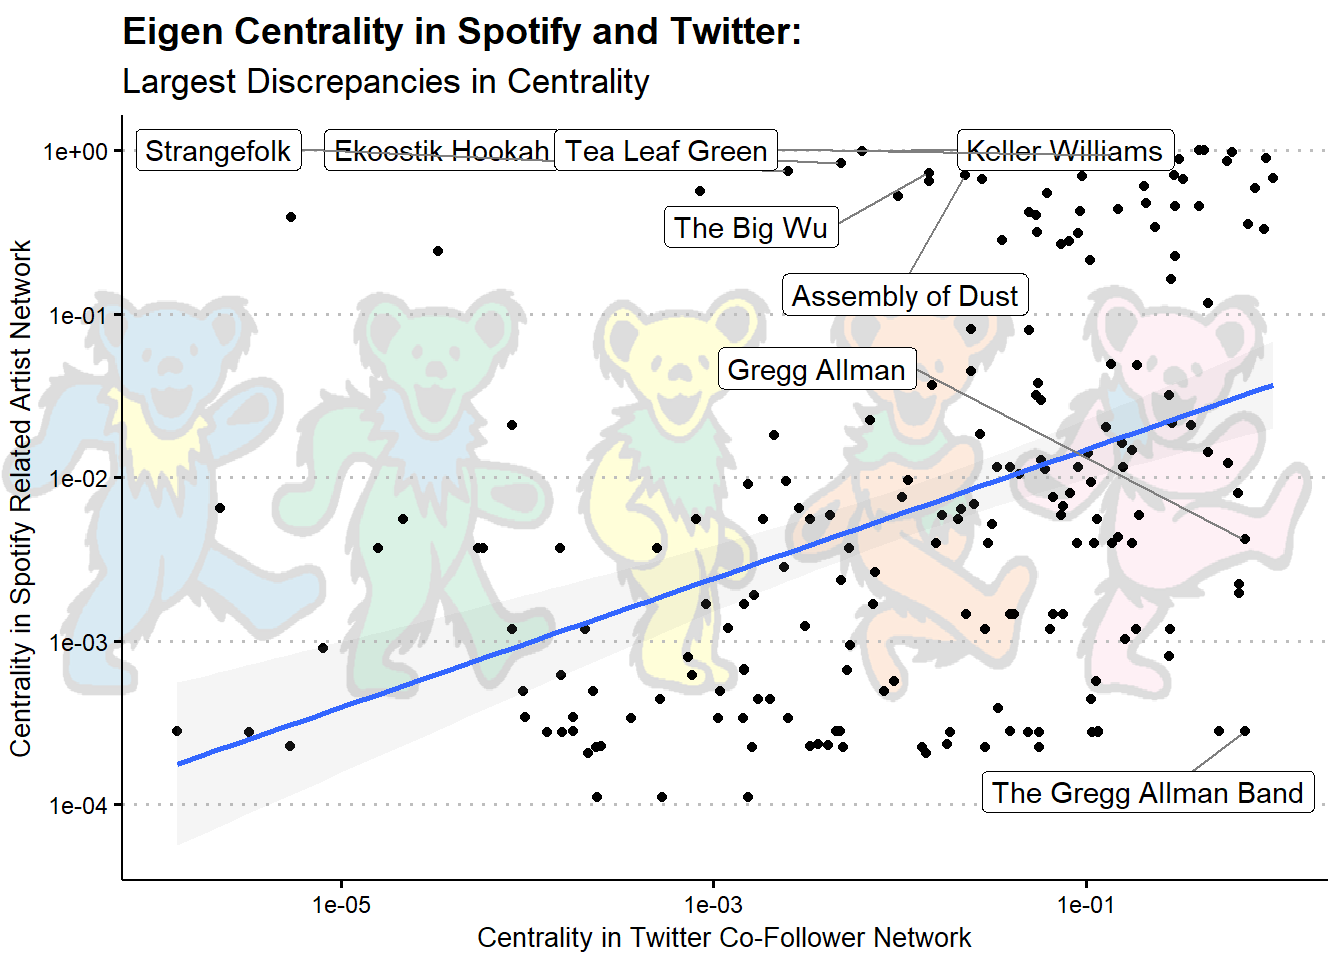
The labels at the top like Keller Williams are artists that are more central in the Dead’s Spotify Recommendation Network than their Twitter Co-Follower Network, and the one’s on the bottom (basically just Greg Allman) are artists more central in Twitter than Spotify. Perhaps this reflects the fact that spotify users tend to be younger than Twitter users, so the former are more interested in modern (related) acts while the latter are more interested in the Dead’s contemporaries.
Caveats & Limitations
Before I conclude, I wanted to point out a couple of caveats and limitations in the above analyses.
First, a fair amount of the artists - especially older artists that died before Twitter existed (e.g., Lowell George) - didn’t have Twitter accounts.
Second, I don’t know the full details of Spotify’s or Twitter’s recommendation systems. It is a distinct possibility that these companies base their recommendations on each others’ data. If that were the case, then we have something akin to methods variance artificially inflating the correlation between artists’ centrality. Spotify does not mention Twitter co-followers in their description of their algorithm, but that doesn’t necessarily rule it out.
Third, this is a single network and we might expect things to look different in other networks. Ideally, one would sample networks and examine the extent to which the pattern varies across networks (e.g., in a HLM/MLM framework). If I find a little more time, I may do this myself and post the results here at some point.
Conclusion
Even with those limitations in mind, I think there is something interesting here. In some ways it is unsurprising that artists with more listeners in common on spotify have more followers in common on Twitter - we might expect fandom to be expressed similarly across many different networks. At the same time, it is a little surprising given the differences in what each platform affords users (music listening & discovery vs. microblogging).
That’s all for now! Tune in for Vol. 2 of Spotify API Fun, where I’ll take a look at community detection algorithms, and the extent to which they find similar communities in the two networks I introduced today.
Cory K. Costello
Predictive Modeler
Personality/Social Psychology PhD interested personality, reputation, and social networks in offline and online environments.